
Calculating Feed Conversion Ratio for Catfish to Improve Feed Efficiency
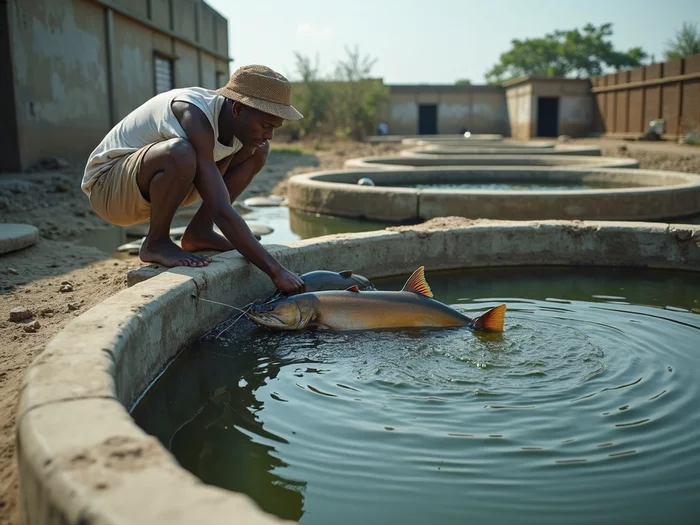
Posted on: 2025-11-03
By: Yomi Adisa
You've invested in quality fingerlings and built your ponds, but watching your feed costs climb month after month whilst your catfish seem to grow slowly can be frustrating. Many African catfish farmers struggle with this exact challenge – knowing whether their fish are converting feed efficiently or if they're simply pouring money into the water.
Understanding and calculating your Feed Conversion Ratio (FCR) is one of the most practical skills you can develop as a catfish farmer. This measurement tells you exactly how much feed your fish need to gain one kilogram of weight, giving you clear insight into your farm's efficiency and profitability.
In Ghana, successful catfish farmers regularly achieve FCR rates of 1.2-1.5, meaning their fish convert feed efficiently and generate better profits. Poor FCR management, however, can push your production costs up by 30-40%, turning a profitable venture into a financial burden.
This guide will teach you how to calculate FCR accurately, identify factors that affect feed efficiency in your ponds, and implement practical strategies to improve your results. You'll learn to recognise the warning signs of poor feed conversion and discover proven techniques that African farmers use to optimise their feeding programmes for maximum profitability.
What You Will Learn
- Learn how to calculate the Feed Conversion Ratio (FCR) accurately for your catfish farm.
- Discover key factors affecting feed efficiency, including fish size, water quality, and feed type.
- Master practical feeding strategies that can improve your FCR and reduce overall feed costs.
- Understand the importance of consistent data collection and monitoring to identify issues early.
- Implement proven techniques used by successful African catfish farmers to optimise production efficiency.
Understanding Feed Conversion Ratio (FCR)
You need to understand Feed Conversion Ratio before you can improve it, yet many catfish farmers in Africa treat FCR as a mysterious number that somehow affects their profits. FCR is actually a straightforward measurement that tells you exactly how efficiently your fish convert feed into body weight. When you grasp this concept, you gain control over one of your biggest production costs.
Most successful catfish operations in Nigeria and Kenya track FCR weekly because it reveals problems before they become expensive disasters. Poor FCR doesn't just mean wasted feed—it often signals underlying issues with water quality management, fish health, or feeding practices that can devastate your entire stock if left unchecked.
Understanding FCR gives you the power to make data-driven decisions about your feeding programme, compare your farm's performance against industry standards, and identify exactly where improvements will deliver the biggest financial returns. Here's what you need to know about this critical measurement.
What is Feed Conversion Ratio?
Feed Conversion Ratio measures how many kilograms of feed your catfish need to gain one kilogram of body weight. You calculate FCR by dividing the total amount of feed given by the total weight gain of your fish over a specific period. A lower FCR number means better efficiency—your fish are converting feed into growth more effectively.
In African catfish (Clarias gariepinus) farming, FCR typically ranges from 1.0 to 2.5 depending on your management practices and conditions. An FCR of 1.2 means your fish need 1.2kg of feed to gain 1kg of weight, which represents excellent efficiency. An FCR of 2.0 or higher indicates problems that are costing you money with every feeding.
You should think of FCR as your farm's efficiency report card. Unlike growth rates that can vary with fish size and season, FCR gives you a consistent way to measure performance across different batches, pond systems, and time periods.
Importance of FCR in Catfish Farming
FCR directly impacts your profitability because feed represents 60-70% of your total production costs in most African catfish operations. When your FCR improves from 2.0 to 1.5, you reduce feed costs by 25% whilst maintaining the same growth rates. For a farmer producing 5 tonnes annually, this improvement can save ₦500,000-800,000 in Nigeria or KES 150,000-250,000 in Kenya.
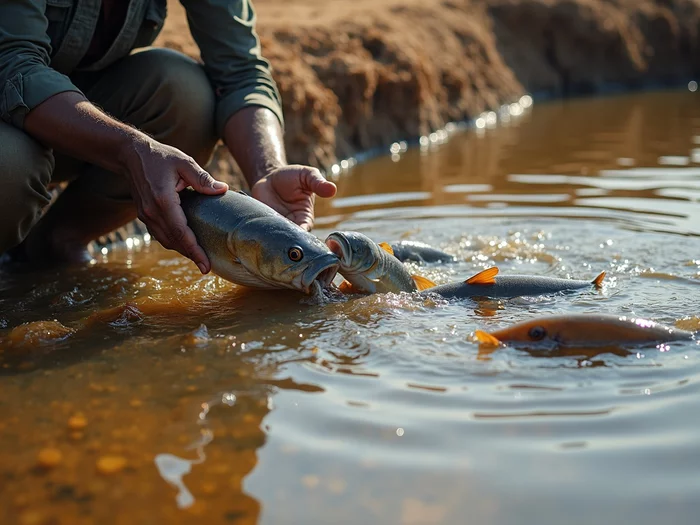
You can use FCR as an early warning system for problems in your ponds. Rising FCR often appears before visible signs of disease, poor water quality, or stress in your fish stock. Farmers in Ghana who monitor FCR weekly catch issues like ammonia spikes or oxygen depletion 3-5 days earlier than those who only watch fish behaviour.
FCR also helps you evaluate different management strategies objectively. You can compare the efficiency of different feed brands, feeding schedules, or stocking densities by measuring their impact on FCR rather than relying on guesswork or supplier claims.
How to Calculate FCR for Catfish
Now that you understand what FCR means for your catfish operation, you need to master the actual calculation process to start tracking your farm's efficiency. Many African farmers avoid calculating FCR because they think it requires complex mathematics or expensive equipment, but the reality is much simpler. You can calculate accurate FCR using basic scales, record-keeping, and a calculator.
The key to reliable FCR calculation lies in consistent data collection rather than sophisticated formulas. You need to weigh your feed accurately, track your fish weights systematically, and maintain detailed records throughout each production cycle. Farmers in Uganda who calculate FCR weekly often discover efficiency improvements worth thousands of shillings per cycle.
Getting your FCR calculations right from the start prevents costly mistakes and helps you identify problems early. Here's exactly how to calculate FCR for your catfish operation, including common pitfalls that can skew your results and lead to poor management decisions.
Basic Formula for FCR Calculation
The FCR formula is straightforward: FCR = Total Feed Given (kg) ÷ Total Weight Gain (kg). You divide the total amount of feed you've provided to your fish by the total weight they've gained during the same period. This gives you a ratio that tells you how efficiently your fish convert feed into body weight.
For example, if you feed 100kg of feed to your catfish over one month and they gain 75kg in total weight, your FCR is 100 ÷ 75 = 1.33. This means your fish need 1.33kg of feed to gain 1kg of body weight, which represents good efficiency for African catfish farming.
You must use the same time period for both measurements—feed given and weight gained. Never mix data from different periods, as this will give you false FCR readings that don't reflect your actual farm performance.
Step-by-Step Calculation Process
Start by weighing your catfish at the beginning of your measurement period using a reliable scale that measures to at least 10g accuracy. Record the total biomass of all fish in your pond or tank system. For a 1000-fish stock averaging 150g each, your starting biomass would be 150kg.
Track every gram of feed you provide during your measurement period, including any supplementary feeds or treats. Use a digital scale to weigh feed portions before each feeding session. If you feed 2.5kg twice daily for 30 days, your total feed input is 150kg.
At the end of your measurement period, weigh your fish again using the same scale and method. If your 1000 fish now average 250g each, your final biomass is 250kg. Your weight gain is 250kg - 150kg = 100kg, giving you an FCR of 150kg ÷ 100kg = 1.5.
Common Mistakes in FCR Calculation
Many farmers in Nigeria make the mistake of not accounting for fish mortality when calculating FCR, which artificially inflates their efficiency numbers. You must subtract the weight of dead fish from your final biomass calculation, or your FCR will appear better than it actually is. If 50 fish died during your measurement period, subtract their estimated weight from your calculations.
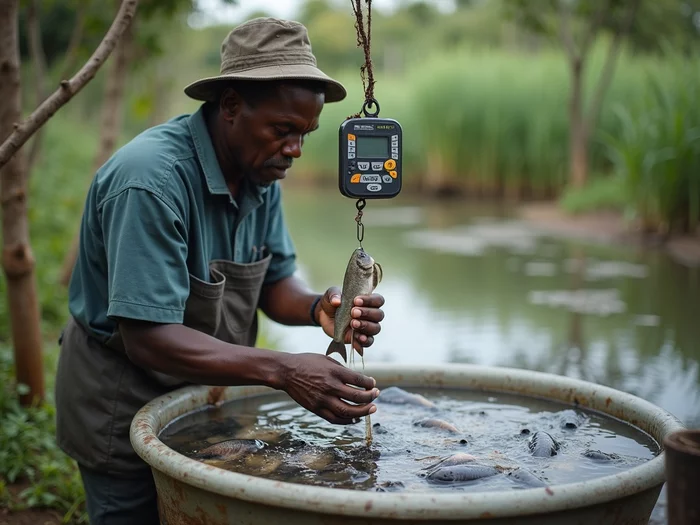
Another common error is using inconsistent weighing methods or scales between measurements. Your starting weight might come from a supplier's estimate whilst your final weight uses your own scale, creating inaccurate comparisons. Always use the same scale and weighing procedure for both initial and final measurements.
Farmers also frequently forget to include all feed sources in their calculations. You must count every feed type—pellets, local ingredients, kitchen scraps, or supplementary feeds. Missing even small amounts of feed can make your FCR appear 10-15% better than reality, leading to overconfident management decisions that hurt profitability.
Factors Affecting FCR in Catfish Production
Your FCR calculations are only as valuable as your understanding of what influences them, and many catfish farmers struggle with inconsistent results because they don't recognise the key factors affecting feed efficiency. African catfish (Clarias gariepinus) are remarkably adaptable, but their feed conversion performance responds dramatically to changes in feed quality, environmental conditions, and fish management practices.
Understanding these factors helps you identify why your FCR might suddenly worsen from 1.4 to 2.1, or why one pond consistently outperforms another despite identical feeding schedules. Farmers in Kenya who master these variables often achieve FCR improvements of 20-30% within a single production cycle, translating to significant cost savings and higher profits.
Each factor interacts with others, creating complex relationships that affect your bottom line. Here's how to recognise and manage the key variables that determine whether your catfish convert feed efficiently or waste your investment.
Feed Type and Quality
The protein content of your feed directly impacts FCR, with African catfish requiring 35-40% protein for optimal conversion during their growth phase. Feeds with protein levels below 32% typically produce FCR values above 2.0, whilst high-quality feeds with 38-42% protein can achieve FCR rates of 1.2-1.5. You'll find that spending an extra ₦50-100 per 25kg bag on higher protein feed often reduces your overall feed costs through improved efficiency.
Floating feeds generally produce better FCR than sinking feeds because you can monitor consumption and avoid overfeeding. Sinking feeds that aren't consumed within 30 minutes decompose in your pond, contributing to poor water quality without providing nutritional benefit. Many farmers in Ghana report FCR improvements of 0.2-0.3 points when switching from sinking to floating pellets.
Feed freshness significantly affects conversion rates, as rancid oils and degraded vitamins in old feed reduce palatability and nutritional value. You should use feed within 3 months of manufacture date and store it in cool, dry conditions to maintain quality. Feeds stored in hot, humid conditions for over 6 months can increase FCR by 15-25% compared to fresh alternatives.
Fish Species and Size
African catfish (Clarias gariepinus) typically achieve their best FCR during the 50-500g growth phase, with rates often improving from 1.8 in fingerlings to 1.3-1.4 in juveniles before gradually increasing again in larger fish. You'll notice that fish under 50g require more frequent feeding and often show FCR values of 1.6-2.0 due to their higher metabolic rates and energy requirements for rapid development.
Fish size affects feeding behaviour and competition within your ponds, influencing overall FCR performance. Uniform-sized fish typically achieve better FCR than mixed-size populations because feeding competition is reduced and you can optimise pellet size for the entire stock. Size variation of more than 30% within a pond often increases FCR by 0.2-0.4 points due to inefficient feeding dynamics.
Stocking density directly impacts FCR through stress and competition effects. You'll achieve optimal FCR with stocking densities of 100-150 fish per cubic metre for African catfish, whilst densities above 200 fish per cubic metre typically increase FCR by 20-40% due to stress-related feeding inefficiency and reduced growth rates.
Environmental Conditions
Water temperature significantly affects catfish metabolism and feed conversion, with optimal FCR occurring at 26-30°C for African catfish. Temperatures below 22°C or above 32°C can increase FCR by 25-50% as fish reduce feeding activity or experience metabolic stress. During cool seasons in Uganda, many farmers notice FCR increases of 0.3-0.5 points compared to warm season performance.
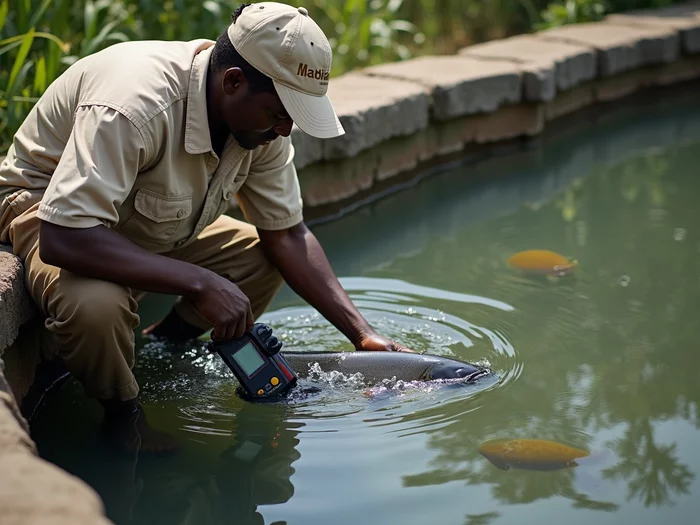
Dissolved oxygen levels below 4mg/L dramatically worsen FCR as fish divert energy from growth to survival functions. You should maintain oxygen levels above 5mg/L for optimal feed conversion, using aeration systems during hot weather or high biomass periods. Poor oxygen management can increase FCR from 1.4 to 2.2 within days, making aeration investment crucial for efficiency.
Water quality parameters like ammonia, nitrites, and pH affect feed conversion through their impact on fish health and appetite. Ammonia levels above 0.5mg/L or pH outside the 6.5-8.5 range typically increase FCR by reducing feeding behaviour and growth rates. Regular water testing and management prevent these efficiency losses that can cost thousands of naira per production cycle.
Practical Tips for Improving Feed Efficiency
Knowing how to calculate FCR and understanding the factors that affect it means nothing without practical strategies to improve your results, yet many African catfish farmers continue using feeding methods that waste 20-30% of their feed investment. Improving feed efficiency requires systematic changes to your feeding practices, nutritional strategies, and monitoring systems rather than hoping for better results with the same old methods.
The most successful catfish operations in Nigeria and Ghana implement specific feeding protocols that consistently achieve FCR values below 1.5, whilst poorly managed farms struggle with FCR above 2.0 using identical feed brands. These differences come down to practical implementation of proven efficiency techniques rather than expensive equipment or complex technology.
Small improvements in feed efficiency compound over time, creating substantial cost savings and profit increases. Here are the practical strategies that consistently deliver better FCR results for African catfish farmers.
Optimised Feeding Practices
You should feed your African catfish 2-3 times daily rather than once daily to improve FCR by 15-25%. Multiple smaller meals allow better digestion and reduce feed waste compared to single large feedings that overwhelm fish capacity. Farmers in Kenya who switched from once-daily to three-times-daily feeding typically see FCR improvements from 1.8 to 1.4 within one production cycle.
Feed at consistent times each day to establish feeding rhythms that improve appetite and digestion efficiency. Your catfish perform best when fed at 8am, 2pm, and 6pm, avoiding feeding during the hottest part of the day when fish are less active. Irregular feeding schedules can increase FCR by 0.2-0.3 points due to stress and reduced feeding response.
Calculate feed amounts based on 3-5% of total biomass daily, adjusting for water temperature and fish behaviour. You'll achieve better FCR by slightly underfeeding active, healthy fish than overfeeding stressed or sick stock. Monitor feeding response carefully—if fish don't consume all feed within 15-20 minutes, reduce the next feeding amount by 10-20%.
Advanced Nutritional Strategies
Supplement your commercial feeds with locally available protein sources like blood meal, fish meal, or soybean meal to boost protein content cost-effectively. Adding 5-10% fish meal to commercial feeds often improves FCR by 0.1-0.2 points whilst reducing feed costs. Many farmers in Ghana mix 2kg fish meal with 23kg commercial feed to create enhanced 25kg batches.
Use probiotics and digestive enzymes to improve feed utilisation and gut health in your catfish. Adding 1-2g of commercial probiotics per kilogram of feed can improve FCR by 8-15% through better nutrient absorption and reduced disease pressure. These supplements cost ₦200-500 per kilogram but often pay for themselves through improved efficiency.
Adjust protein levels based on fish size and growth stage rather than using the same feed throughout production. Start fingerlings on 40-42% protein feeds, reduce to 35-38% for juveniles, and finish with 32-35% protein feeds for market-size fish. This staged approach can improve overall FCR by 10-20% compared to single-feed strategies.
Monitoring and Data Collection Techniques
Weigh a sample of 50-100 fish weekly to track growth rates and calculate running FCR values rather than waiting until harvest to assess performance. Use a large basin or tank to contain fish during weighing, and always use the same scale for consistency. Weekly monitoring allows you to identify problems early and adjust feeding strategies before efficiency losses become severe.
Keep detailed feeding records that include date, time, amount fed, weather conditions, and fish behaviour observations. Use a simple notebook or smartphone app to record this information immediately after each feeding. These records help you identify patterns that affect FCR and make data-driven improvements to your feeding programme.
Measure water quality parameters weekly and correlate them with FCR performance to identify environmental factors affecting efficiency. Track temperature, dissolved oxygen, pH, and ammonia levels alongside your feeding data. Farmers who maintain these records often discover specific conditions that improve or worsen FCR, allowing targeted management interventions.
Case Studies and Real-World Applications
Learning from other farmers' successes and failures provides valuable insights that can save you months of trial and error in improving your FCR performance. Across Africa, catfish farmers have discovered practical solutions to common efficiency problems, often achieving dramatic improvements through simple management changes rather than expensive infrastructure investments.
Real-world applications of FCR improvement strategies demonstrate that consistent implementation of basic principles delivers better results than sporadic attempts at complex interventions. Farmers who systematically apply proven techniques typically see FCR improvements within 4-6 weeks, whilst those who make random changes often see no improvement or even worse performance.
These case studies show you exactly how successful farmers identified their efficiency problems, implemented solutions, and measured results. Here's what works in practice for African catfish operations.
Success Stories from Catfish Farmers
James Okafor in Ogun State, Nigeria, reduced his FCR from 2.1 to 1.4 over six months by implementing systematic feeding schedules and water quality management. He started weighing fish weekly, adjusted feeding amounts based on actual consumption, and installed a simple paddle wheel aerator that cost ₦85,000. His feed costs dropped by 33% whilst maintaining the same growth rates, saving ₦400,000 per production cycle.
Mary Wanjiku in Kiambu County, Kenya, improved her FCR from 1.8 to 1.3 by switching to floating feeds and implementing three-times-daily feeding. She invested KES 15,000 in a digital scale for accurate feed measurement and KES 25,000 for higher-quality floating pellets. Her improved efficiency generated additional profits of KES 180,000 per cycle, paying back her investments within two production rounds.
These farmers succeeded because they focused on consistent implementation of basic principles rather than searching for complex solutions. They measured results weekly, adjusted practices based on data, and maintained detailed records that helped them identify what worked best for their specific conditions.
Comparative Analysis of FCR Across Systems
Pond-based catfish systems in Ghana typically achieve FCR values of 1.4-1.8, whilst recirculating aquaculture systems (RAS) often reach 1.2-1.5 due to better environmental control and feeding management. However, RAS requires higher initial investment and technical expertise, making pond systems more practical for most African farmers despite slightly higher FCR values.
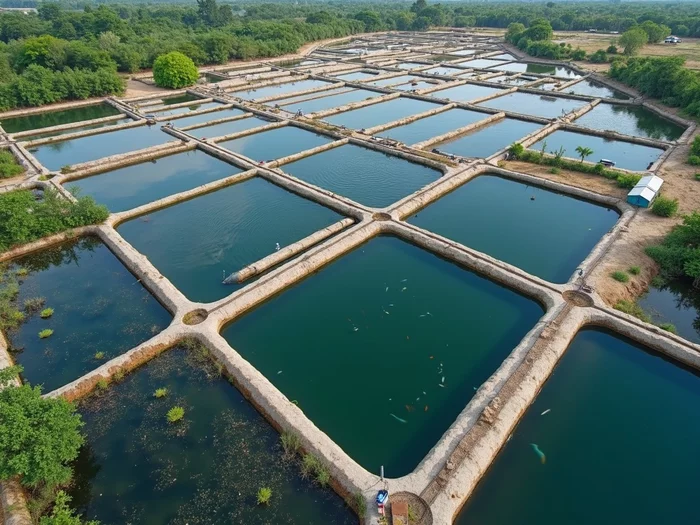
Concrete pond systems generally outperform earthen ponds for FCR efficiency, with typical improvements of 0.2-0.4 points due to easier cleaning, better water quality control, and reduced disease pressure. A farmer in Uganda reported FCR improvements from 1.9 in earthen ponds to 1.5 in concrete systems, though construction costs were 40% higher.
Intensive systems with higher stocking densities and supplemental aeration achieve better FCR than extensive systems when properly managed. However, intensive systems require more technical skill and higher operating costs, making them suitable mainly for experienced farmers with reliable electricity and technical support. The key is matching your system choice to your management capabilities and local conditions.
Troubleshooting Poor FCR
When your FCR suddenly worsens or consistently underperforms, you need systematic troubleshooting methods to identify and fix the underlying problems quickly. Many African catfish farmers panic when FCR increases, making hasty changes that often worsen the situation rather than addressing root causes.
Poor FCR rarely results from single factors—usually multiple issues combine to reduce feed efficiency, requiring methodical investigation to identify all contributing problems. Successful troubleshooting follows logical steps that help you prioritise interventions and measure their effectiveness before making additional changes.
Identifying Common Issues
Start troubleshooting by checking your feed quality and storage conditions, as deteriorated feed is the most common cause of sudden FCR increases. Examine feed for mould, rancid odours, or pest damage, and verify storage temperatures haven't exceeded 30°C. Feed stored in hot, humid conditions for over 4 months often shows FCR increases of 20-40% compared to fresh alternatives.
Assess water quality parameters systematically, testing dissolved oxygen, ammonia, nitrites, and pH levels. Low oxygen below 4mg/L or high ammonia above 1mg/L typically increase FCR by 25-50% within days. Many farmers in Nigeria discover that poor FCR correlates directly with rainy season water quality problems or equipment failures that reduce aeration.
Observe fish behaviour during feeding times to identify health or stress issues affecting appetite. Healthy catfish should respond eagerly to feeding, consuming pellets within 15-20 minutes. Sluggish feeding response, surface gasping, or erratic swimming often indicate disease or environmental stress that worsens FCR before visible symptoms appear.
Practical Solutions for Improvement
Address water quality problems immediately through increased aeration, partial water changes, or reduced feeding until conditions improve. Install backup aeration systems or manual paddle wheels to maintain oxygen levels during power outages. Farmers in Ghana who invested ₵2,000-5,000 in backup aeration often prevent FCR disasters that could cost ₵20,000-50,000 in lost efficiency.
Implement gradual feeding adjustments rather than dramatic changes when FCR problems appear. Reduce feeding amounts by 20-30% for 3-5 days whilst addressing underlying issues, then gradually return to normal levels as conditions improve. Sudden feeding changes often stress fish further and worsen FCR performance.
Consider prophylactic treatments for parasites or bacterial infections if FCR problems persist despite good water quality and feed management. Consult with aquaculture extension officers or veterinarians for appropriate treatments, as untreated health issues can maintain poor FCR for weeks or months. Early intervention typically costs less than prolonged efficiency losses.
Technology and Tools for FCR Calculation
Modern technology offers African catfish farmers practical tools to calculate and monitor FCR more accurately than traditional pen-and-paper methods, though you don't need expensive equipment to achieve good results. Simple digital tools and smartphone applications can streamline your data collection and provide insights that improve decision-making and farm profitability.
The key is choosing tools that match your technical comfort level and farm scale rather than investing in complex systems you won't use consistently. Many successful farmers in Kenya and Nigeria achieve excellent FCR management using basic digital scales, smartphone apps, and simple spreadsheets rather than sophisticated monitoring equipment.
Here are the practical technology options that can improve your FCR calculation accuracy and help you make better feeding decisions for your catfish operation.
Software and Apps for Monitoring FCR
AquaManager and FishFarm Pro are smartphone applications designed for aquaculture record-keeping that include FCR calculation features. These apps cost $5-15 monthly but automatically calculate FCR as you input feeding and weighing data. You can track multiple ponds separately and generate reports that show FCR trends over time.
Microsoft Excel or Google Sheets provide free alternatives for FCR tracking if you're comfortable with basic spreadsheet functions. Create simple templates that calculate FCR automatically when you enter feed amounts and fish weights. Many farmers in Ghana use shared Google Sheets that allow family members to input data from different locations.
WhatsApp groups dedicated to catfish farming often share FCR calculation templates and troubleshooting advice from experienced farmers. Join groups specific to your region to access local knowledge about feed suppliers, pricing, and management techniques that affect FCR performance in your area.
Innovations in Feed Technology
Extruded floating feeds represent the most significant recent improvement in feed technology for African catfish farming, offering better digestibility and reduced waste compared to traditional pelleted feeds. These feeds typically improve FCR by 0.2-0.4 points but cost 10-20% more than standard pellets. The efficiency gains usually justify the higher cost through reduced total feed requirements.
Slow-sinking feeds provide a compromise between floating and sinking options, allowing better consumption monitoring whilst accommodating catfish feeding preferences. Several Nigerian feed manufacturers now produce slow-sinking formulations specifically for African catfish that achieve FCR improvements of 10-15% compared to traditional sinking pellets.
Probiotic-enhanced feeds are becoming available from major African feed manufacturers, incorporating beneficial bacteria that improve digestion and reduce disease pressure. These feeds cost 15-25% more than standard options but often deliver FCR improvements of 8-12% along with reduced medication needs and better fish health.
Additional Tools for Data Collection
Digital hanging scales with 10g accuracy provide reliable fish weighing for FCR calculations without requiring expensive platform scales. Models costing ₦15,000-25,000 in Nigeria or KES 3,000-5,000 in Kenya offer sufficient accuracy for most farm operations. Choose scales with large displays that are easy to read in outdoor conditions.
Waterproof notebooks or smartphone cases protect your record-keeping materials from pond-side moisture and splashing during feeding and weighing activities. Consistent data collection requires tools that work reliably in wet conditions. Many farmers use laminated data sheets that can be written on with pencil and erased for reuse.
Simple water testing kits for pH, ammonia, and dissolved oxygen help you correlate water quality with FCR performance. Basic test kits cost ₦5,000-10,000 but provide valuable data for understanding efficiency variations. Digital metres offer more accuracy but cost significantly more and may not be necessary for basic FCR troubleshooting.
Summary Table
| Key Points | Details |
|---|---|
| Understanding FCR | FCR = Total Feed Given (kg) ÷ Total Weight Gain (kg). Typical range for African catfish is 1.0 to 2.5. |
| Optimal FCR Values | Successful farmers achieve FCR of 1.2-1.5, reducing feed costs by 25% when improved from 2.0 to 1.5. |
| Feed Quality | Optimal protein content is 35-40%. High-quality feeds can achieve FCR of 1.2-1.5. |
| Feeding Practices | Feed 2-3 times daily; calculate feed at 3-5% of total biomass. Adjust based on fish behaviour. |
| Stocking Density | Optimal density is 100-150 fish/m³. Density above 200 can increase FCR by 20-40%. |
| Environmental Conditions | Optimal water temperature for FCR is 26-30°C. Maintain dissolved oxygen above 5mg/L. |
| Monitoring Techniques | Weigh fish weekly and maintain detailed feeding records to track performance and adjust strategies. |
| Common Mistakes | Neglecting fish mortality in calculations and inconsistent weighing methods can skew FCR results. |
Conclusion
Calculating and managing your Feed Conversion Ratio gives you direct control over your biggest production cost—feed expenses that represent 60-70% of your total catfish farming investment. By tracking FCR weekly and implementing the feeding strategies outlined in this guide, you can reduce feed costs by 20-30% whilst maintaining strong growth rates. The difference between an FCR of 2.0 and 1.4 can save you hundreds of thousands of naira or shillings per production cycle.
You now have the practical knowledge to calculate FCR accurately, identify problems early, and implement proven solutions that work for African catfish operations. Start with consistent data collection and basic improvements to your feeding schedule. Your results will improve as you gain experience reading your fish and adjusting your management practices.
As you master FCR management, consider exploring advanced topics like water quality optimisation and disease prevention. These areas work together with feed efficiency to create a complete management system that maximises your catfish farming profitability and sustainability. For comprehensive insights into feed management strategies that can transform your operation, understanding the broader business implications of feed efficiency becomes crucial for long-term success.
Many successful farmers also find that optimising feed conversion ratios for other species like tilapia provides valuable comparative insights that can improve their overall aquaculture management approach.
Frequently Asked Questions
How often should I calculate FCR for my African catfish?
You should track FCR weekly to ensure you identify problems early, before they become expensive. Consistent weekly monitoring allows you to make timely adjustments to your feeding programme and management practices, preventing significant losses in efficiency and profitability.
What FCR is considered good for African catfish (Clarias gariepinus)?
An FCR between 1.2 and 1.5 is considered excellent for African catfish farming, indicating efficient feed conversion. Values above 2.0 typically point to problems that are costing you money. Your goal should be to consistently achieve an FCR below 1.5.
What impact does fish mortality have on FCR calculation?
Fish mortality can significantly skew your FCR, making it appear better than it actually is. You must subtract the estimated weight of any dead fish from your final biomass calculation to ensure accurate FCR readings. Failing to do so will lead to overconfident management decisions.
Can I improve my FCR by feeding my catfish more frequently?
Yes, feeding your African catfish 2-3 times daily, rather than once, can improve FCR by 15-25%. Smaller, more frequent meals improve digestion and reduce feed waste. Aim for consistent feeding times to establish routines that enhance appetite and efficiency.
What water quality parameters most directly impact African catfish FCR?
Water temperature, dissolved oxygen, ammonia, nitrites, and pH are crucial. Optimal FCR for African catfish occurs at 26-30°C and dissolved oxygen levels above 5mg/L. High ammonia or extreme pH levels will directly reduce feeding behaviour and growth, significantly worsening FCR.


Yomi Adisa Lead Researcher
Yomi Adisa is the lead researcher at Fish Farming Business, where he studies what makes aquaculture ventures profitable across Africa. His research focuses on market patterns, buyer preferences, and the business decisions that determine success or failure in fish farming.